Before we start
Few comments:
- We are deploying our Prometheus using kube-prometheus-chart.
- The chart version that we use is 35.3.0.
- We assume the readers are familiar with helm.sh.
- The application is deployed in the same kubernetes cluster as Prometheus.
Problem statement
We have an application in a kubernetes cluster with metrics endpoint. We want to the application’s metrics endpoint to be scrapped by Prometheus.
When I did this last year (at my previous employer), I did it via additional_scrape_config.
However I just discovered that Prometheus has this PodMonitor and ServiceMonitor custom resources, that would
be easier to manage than updating prometheus settings.
Note there are two options for scraping as indicated by the available monitors above, we could either scrape the service endpoint of the application or the application pods themselves. We chose to scrape the pods endpoints as it will give a true(r) representation of the application metrics. Scraping service endpoint means you are getting a randomised metric out of the application pods (service is basically a round robin load balancer).
How does PodMonitor works?
PodMonitor, which declaratively specifies how group of pods should be monitored. The Operator automatically generates Prometheus scrape configuration based on the current state of the objects in the API server.
Configure Prometheus for PodMonitor
First of all, we need to add the following to a values.yaml file:
prometheus:
  prometheusSpec:
    podMonitorSelector:
      matchLabels:
        prometheus: "true"
The config above tells prometheus to register pod monitor objects that has labels prometheus="true".
We then upgrade our prometheus installation by running the following command:
helm upgrade prometheus prometheus-community/kube-prometheus-stack -f values.yaml --namespace prometheus --version 35.3.0
Note: I like to a dry-run and inspect the kubernetes manifests produced to ensure that my changes present, e.g check
that podMonitorSelector exists on the manifest.
An application to monitor
We would need an application to monitor, I found this golang prometheus example app fits the bill - install it by running:
kubectl create ns prometheus-example-app
kubectl apply -f https://raw.githubusercontent.com/brancz/prometheus-example-app/master/manifests/deployment.yaml -n prometheus-example-app
Create a PodMonitor
Next, we want to create a pod monitor object, prometheus operator has an example manifest for it.
My pod monitor manifest:
apiVersion: monitoring.coreos.com/v1
kind: PodMonitor
metadata:
  name: prometheus-example-pod-monitor
  namespace: prometheus
  labels:
    prometheus: "true"
spec:
  selector:
    matchLabels:
      prometheus.io/scrape: "true"
  namespaceSelector:
    matchNames:
    - prometheus-example-app
  podMetricsEndpoints:
    - targetPort: 8080
A commentary on the above:
- I created the pod monitor on prometheus namespace (the same namespace as my prometheus installation), in my opinion this is a good way to organise pod and service monitors.
- I added labels
prometheus=truematching the prometheus config change above. - I specify the namespace and the labels of the application that I want to scrape. Note I use
prometheus.io/scrapelabel as selector, I will need to add this label to the prometheus-example-app after this. - The example app runs on port 8080 - ensure that this reflected on
podMetricsEndpoints.
Next step is to add the prometheus.io/scrape=true label on the app’s deployment.
This can be done by editing the deployment: kubectl edit deployment prometheus-example-app -n prometheus-example-app.
Once that’s done, do a port-forward on prometheus k port-forward svc/prometheus-kube-prometheus-prometheus 9090:9090.
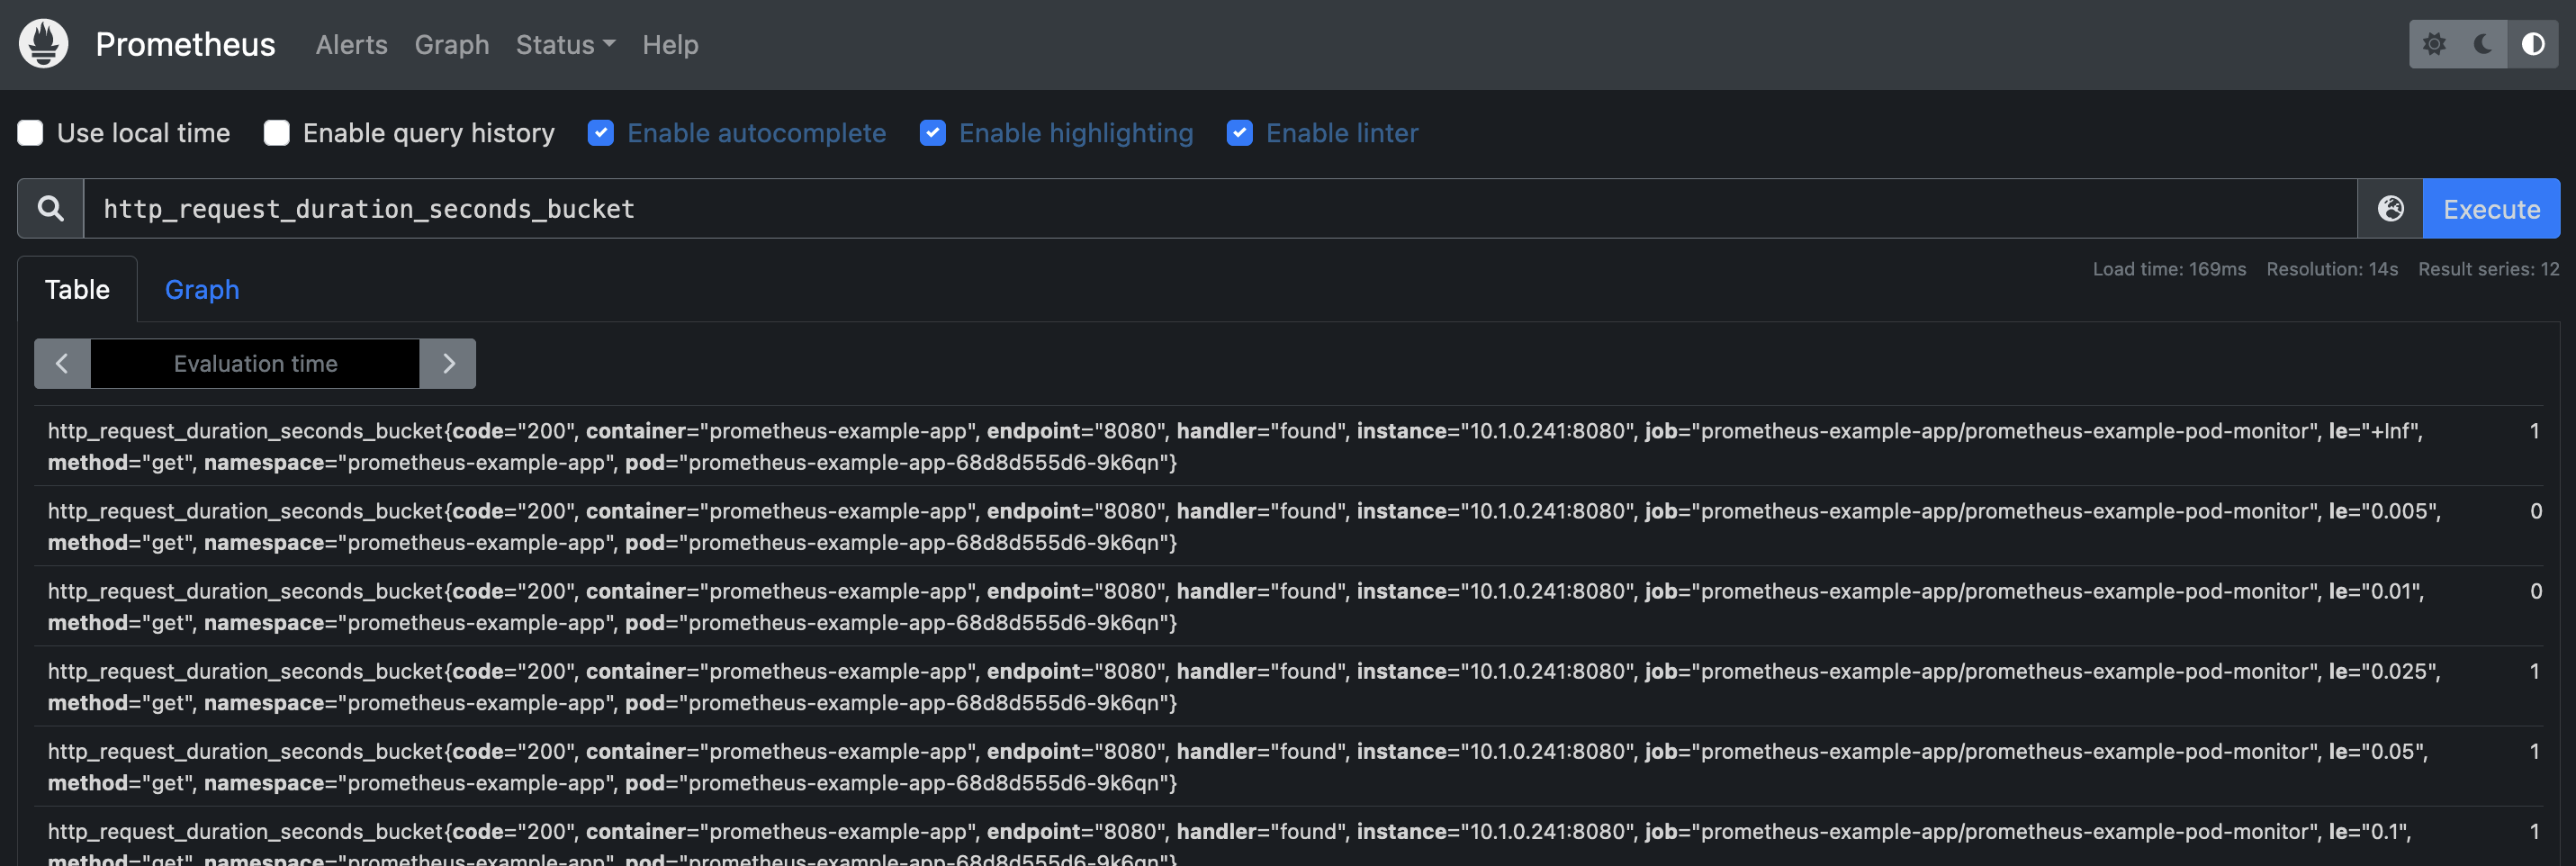
Validate the application metrics is correctly scraped - the easiest way is to enter http_request_duration_seconds_bucket (the metric
that example app produced) into the query input on Prometheus home and hit enter, if results are produced that means the scrape is
a success.
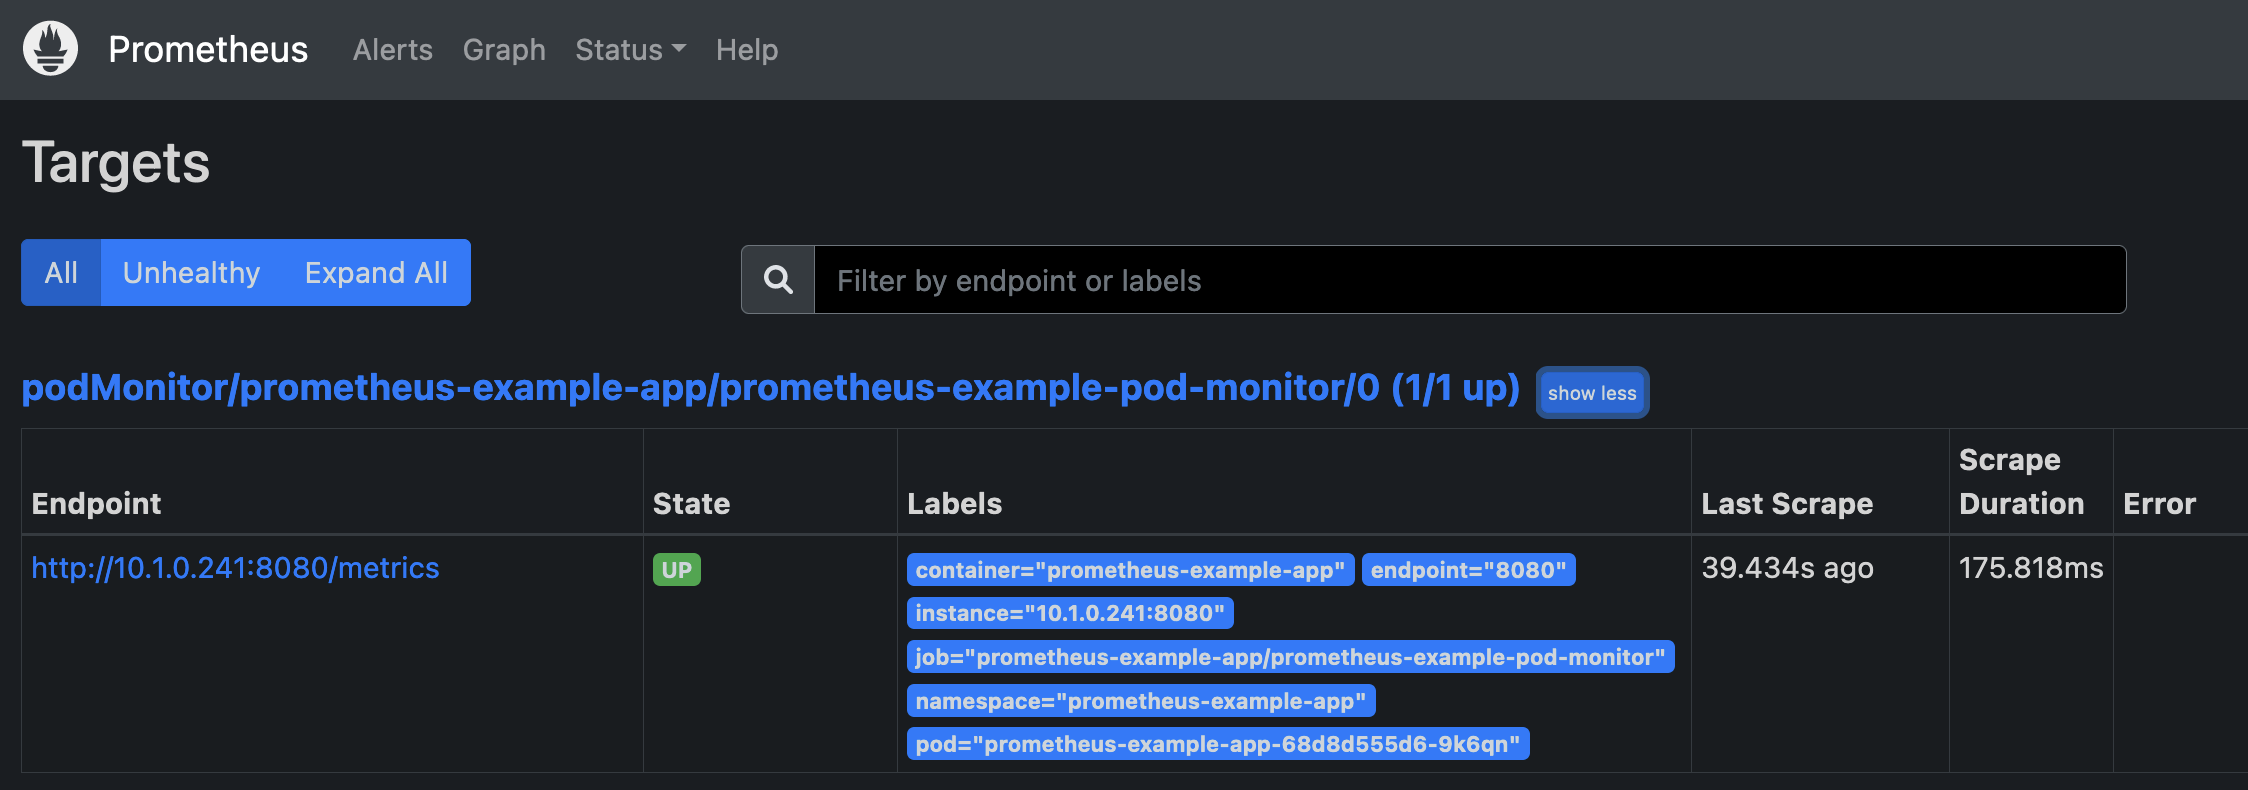
Another way is to check the targets section of Prometheus, ensure that the application is listed.
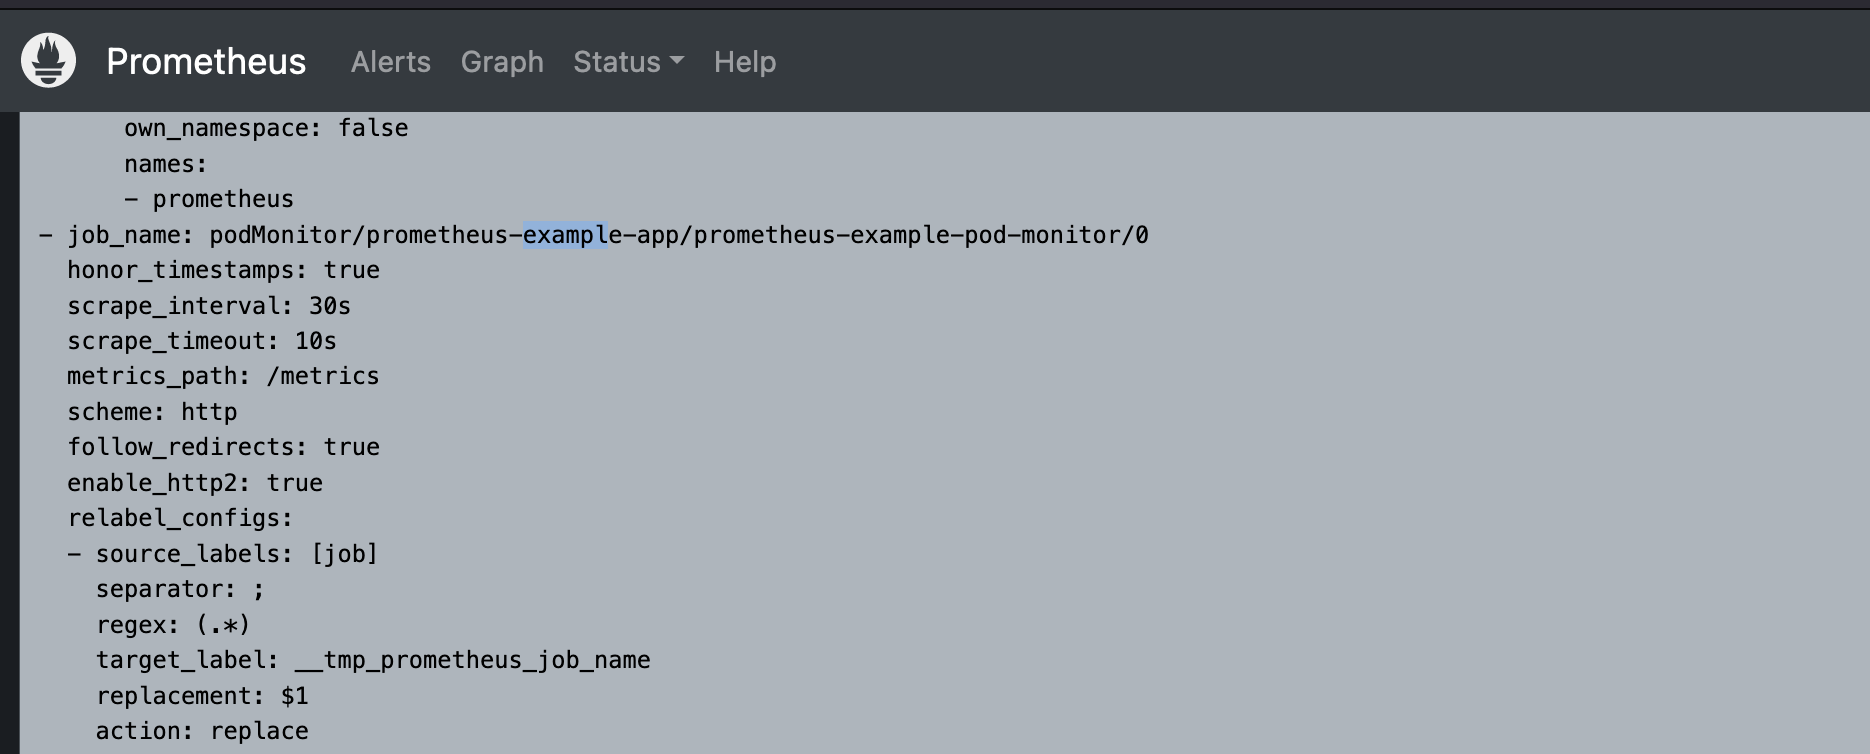
Last thing, just to tie everything together, remember that PodMonitor works by inspecting the state of pods to be monitored (as specified by label and namespace selector) and making corresponding changes to Prometheus’ config as needed. So let’s check what modification to the config that PodMonitor did, go to configuration section of Prometheus and search for the application name - you’ll see the scrape_config change that PodMonitor created.
Recording
I want to get better at my communication skill - so I recorded myself doing the steps in this post. Please watch the amateur hour here 😭 (gosh I hate my voice, no need to like, click and subscribe):